Battery Fuel Gauge: Factual or Fallacy?

Many perceive a battery as being an energy storage device that is similar to a fuel tank dispensing liquid fuel. For simplicity, a battery can be seen as such; however, measuring stored energy from an electrochemical device is far more complex. The process is fraught with confusion, is poorly understood, and this article describes the challenges of measuring energy from a battery.
Before looking into the fuel gauge concept deeper, we assume that state-of-charge (SoC) is the relative stored energy in a battery that can be released under prevailing conditions. The prevailing conditions are mostly unknown to the battery user, and besides SoC they include the actual battery capacity, load currents and operating temperature. State-of-function (SoF), the all-encompassing criteria that includes SoC, capacity and delivery, is difficult to measure and remains mostly guesswork. Considering these limitations, one can appreciate why most battery fuel gauges are inaccurate.
Unlike a fuel tank that has a known volumetric dimension, the fuel gauge of a battery has unconfirmed definitions. Other than the open circuit voltage (OCV), which only approximates SoC, a battery does not have fundamental internal parameters that relate to SoC. The Ah rating, which the manufacturer specifies, only applies for the short time when the battery is new. In essence, a battery is a shrinking vessel that takes less energy with each subsequent charge, and the stated Ah rating is only a reference of what the battery should be holding. The battery is not an energy container per se that guarantees a given amount of energy under all conditions but exhibits a human quality delivering on prevailing situations.
A common error in fuel gauge design is ignoring the aging aspect by assuming that the battery will stay perfect. Such oversight will limit the service to about two years before the readings become inaccurate. The scaling of most fuel gauges is analogous to liquid fuel: full charge indicates 100% and empty is zero percent. Zero is the point when the battery reaches the low voltage knee at the end of discharge.
Discharging a battery rated at 1Ah should provide a current of 1A for one hour. This only holds true while the battery is new and discharged at room temperature. If the capacity shrinks to 50%, the fuel gauge of a fully charged battery will still show 100% but the expected one-hour runtime is reduced to 30 minutes. Running the battery below freezing reduces the time further. For the casual cellphone or laptop user, this error only causes inconvenience; however, the problem becomes more evident with electric vehicles and other critical battery operated devices that depend on the remaining runtime to reach the destination.
Modern fuel gauges adapt to prevailing conditions by “learning” how much energy the battery was able to deliver on the previous discharge. Learning, or trending, may also include charge time because a faded battery charges quicker than a good one. It is also common to measure the internal battery resistance by observing the voltage drop; however, capacity estimation based on raising resistance no longer works well because the modern Li-ion maintains low resistance through most of its service life.
Capacity is best measured by discharging a fully charged battery at a constant current and reading the elapsed time. Most rechargeable batteries for portable use are specified at 1C discharge. A battery rated at 1Ah would therefore discharge at 1A. The rated discharge of primary cells, such as alkaline, is much lower. Measuring battery capacity by discharge/charge is impractical and stresses the battery.
Calibration
The fuel gauge has the inherent drawback of needing periodic calibration, also known as capacity re-learning. This is done to correct the tracking error that develops between the chemical and digital battery on repeated charge and discharge cycles. Calibration could be omitted if the battery received a periodic full discharge at constant current followed by a full charge. The battery would reset with each full cycle and the tracking error would be kept at less than one percent per cycle. In real life, however, a battery may be discharged for a few minutes with a load signature that is difficult to capture, then partially recharged and stored with varying levels of self-discharge depending temperature and age.
Manual calibration is possible by running the battery down until “Low Battery” appears. This can be done in the equipment or with a battery analyzer. A full discharge sets the discharge flag and the subsequent recharge the charge flag. Establishing these two markers allows SoC to be calculated by tracking the distance between the flags. For best results, calibrate a device in continuous use every three months or after 40 partial cycles. If the device applies a periodic deep discharge on its own accord, no additional calibration will be required. Figure 1 shows the full-discharge and full-charge flags.

Figure 1: Full-discharge and full-charge flags set calibration
Calibration occurs by applying a full charge, discharge and charge. This can be done in the equipment or with a battery analyzer as part of battery maintenance.
Courtesy Cadex
What happens if the battery is not calibrated regularly? Can such a battery be used with confidence? Most smart battery chargers obey the dictates of the chemical battery rather than the electronic circuit and there are no safety concerns if out of calibration. The battery will charge fully and function normally but the digital readout may be inaccurate and become a nuisance.
Measure State-of-charge
Measuring state-of-charge by voltage is simple but it can be inaccurate and here is why. Batteries within a given chemistry have dissimilar architectures and deliver unique voltage profiles. Temperature also plays a role; heat raises the voltage, a cold ambient lowers it. This phenomenon applies to all chemistries in varying degrees. Furthermore, when disturbing the battery with a charge or discharge, the open circuit voltage no longer represents the true SoC reading and the battery will require a few hours of rest to regain equilibrium; battery manufacturers recommend 24 hours. While lead acid batteries have a gradual voltage drop on discharge, nickel- and lithium-based batteries tend to be flat and SoC estimation by voltage is difficult. Consumer products using the voltage-based fuel gauges limit the readout to show full charge, mid-range and low charge.
A more advanced method to measure SoC is coulomb counting. The theory that goes back 250 years when Charles-Augustin de Coulomb first established the “Coulomb Rule.” It works on the principle of measuring in and out flowing currents. Figure 2 illustrates the principle graphically.

Figure 2: Principle of a fuel gauge based on coulomb counting
The stored energy represents state-of-charge; a circuit measures the in-and-out flowing current.
Courtesy of Cadex
Coulomb counting experiences errors as well. For example, if a battery was charged for one hour at one ampere, the same amount of energy should be available on discharge. This is not the case. Inefficiencies in charge acceptance, especially towards the end of charge, as well as losses during discharge and storage reduce the total energy delivered and skew the readings. The available energy is always less than what had been fed into the battery. For example, the energy cycle (charging and then discharging) of the Li-ion batteries in the Tesla Roadster is about 86% efficient.
As with any numeric integration technique, coulomb counting accumulates error over time, which the modern fuel gauge tries to correct using voltage curves. Since these voltage curves harbor inaccuracies themselves, especially as the battery ages, the accuracy will continue to degrade over time.
The Adaptive System on Diffusion (ASOD) by Cadex features a unique “Learn” function that adjusts to battery aging and achieves a capacity estimation of +/-2% across 1,000 battery cycles, the typical life span of a battery. The SoC estimation is within +/-5%, independent of age and polarization. ASOD does not require outside parameters; it is self-learning. When replacing the battery, the learned matrix will gradually adapt to the new battery through use and achieve the previous high accuracy again.
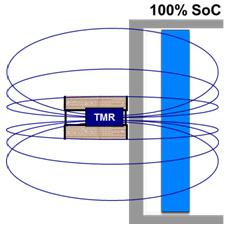
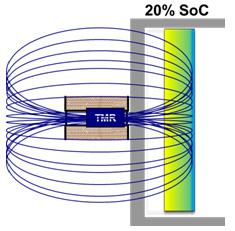
Researchers are exploring new methods to measure battery SoC, and such an innovative technology is quantum magnetism (Q-Mag™). Q-Mag by Cadex does not rely on voltage or current flow but it looks at magnetism. The negative plate on a discharging lead acid battery changes from lead to lead sulfate, which has a different magnetic susceptibility than lead. A sensor based on a quantum mechanical process reads the magnetic field through a process called tunneling. Figure 3 compares the magnetic field response of a fully charged battery to one that is 20% charged. A low battery has a three-fold increase in magnetic susceptibility compared to one that is fully charged.
|
| Figure 3: SoC by magnetic field response The permeability of the plates increases by a factor of 3 from full charge to empty. TMR is Tunneling Magneto Resistance, also known as magnetic tunneling junction (MTJ)
|
It is conceivable that a new technology has been found that can measure battery SoC with an accuracy that was not imaginable before. Knowing the precise intrinsic SoC enables improved chargers but more importantly, the technology provides battery diagnostics, including capacity estimation and end-of-life prediction. The immediate benefit, however, lies in building a better and more accurate fuel gauge.
Li-ion, including lithium iron phosphate, has a very flat discharge curve. Figure 4 shows a linear drop of the relative magnetic field units on discharge and a corresponding raise on charge when monitored with Q-Mag. There is no rubber-band effect associated with the voltage method in which discharge lowers the voltage and charge raises it. Q-Mag takes readings while the battery is being charged or is under load. The SoC accuracy with Li-ion is +/-5%, lead acid is +/-7%; calibration occurs by applying a full charge. The excitation current is less than 1mA, and the system is immune to most interference. Q-Mag works with cells encased in foil, aluminum, stainless steel, but not ferrous metals. The tests are conducted in the laboratories of Cadex Electronics Inc.

Figure 4: Magnetic field measurements of a lithium iron phosphate during charge and discharge.
Relative magnetic field units provide accurate state-of-charge of lithium- and lead-based batteries.
Summary
SoC measurements consist of several readings, and the most common ones are voltage, current and coulomb counting. While the accuracy of these systems is good enough for consumer products where a false indication only causes mild annoyance, medical and military devices, as well as the electric vehicle demand more. A stranded motorist with a mistaken empty battery would attract more media attention than a dropped call of a dead cell phone or a computer screen going dark too soon.
Although noticeable improvements have been made in SoC accuracies, further advances are needed and innovative new technologies are promising. They will not only provide better SoC accuracies but offer state-of-health and end-of-life prediction. Scientists predict that these developments will be available at competitive prices. With these forward-looking technologies in mind, the modern battery fuel gauge will no longer remain a fallacy but become factual.
Last Updated: 21-Apr-2016

Batteries In A Portable World
The material on Battery University is based on the indispensable new 4th edition of "Batteries in a Portable World - A Handbook on Rechargeable Batteries for Non-Engineers" which is available for order through Amazon.com.
Find An Article
Table of Contents
-
Introduction
- BU-001: Sharing Battery Knowledge
- BU-002: Introduction
- BU-003: Dedication
-
Crash Course on Batteries
- BU-101: When Was the Battery Invented?
- BU-102: Early Innovators
- BU-103: Global Battery Markets
- BU-103a: Battery Breakthroughs: Myth or Fact?
- BU-104: Getting to Know the Battery
- BU-104a: Comparing the Battery with Other Power Sources
- BU-104b: Battery Building Blocks
- BU-104c: The Octagon Battery – What makes a Battery a Battery
- BU-105: Battery Definitions and what they mean
- BU-106: Advantages of Primary Batteries
- BU-106a: Choices of Primary Batteries
- BU-107: Comparison Table of Secondary Batteries
-
Battery Types
- BU-201: How does the Lead Acid Battery Work?
- BU-201a: Absorbent Glass Mat (AGM)
- BU-201b: Gel Lead Acid Battery
- BU-202: New Lead Acid Systems
- BU-203: Nickel-based Batteries
- BU-204: How do Lithium Batteries Work?
- BU-205: Types of Lithium-ion
- BU-206: Lithium-polymer: Substance or Hype?
- BU-208: Cycling Performance
- BU-209: How does a Supercapacitor Work?
- BU-210: How does the Fuel Cell Work?
- BU-210a: Why does Sodium-sulfur need to be heated
- BU-210b: How does the Flow Battery Work?
- BU-211: Alternate Battery Systems
- BU-212: Future Batteries
- BU-214: Summary Table of Lead-based Batteries
- BU-215: Summary Table of Nickel-based Batteries
- BU-216: Summary Table of Lithium-based Batteries
- BU-217: Summary Table of Alternate Batteries
- BU-218: Summary Table of Future Batteries
-
Packaging and Safety
- BU-301: A look at Old and New Battery Packaging
- BU-301a: Types of Battery Cells
- BU-302: Series and Parallel Battery Configurations
- BU-303: Confusion with Voltages
- BU-304: Why are Protection Circuits Needed?
- BU-304a: Safety Concerns with Li-ion
- BU-304b: Making Lithium-ion Safe
- BU-304c: Battery Safety in Public
- BU-305: Building a Lithium-ion Pack
- BU-306: What is the Function of the Separator?
- BU-307: How does Electrolyte Work?
- BU-308: Availability of Lithium
- BU-309: How does Graphite Work in Li-ion?
- BU-310: How does Cobalt Work in Li-ion?
- BU-311: Battery Raw Materials
-
Charge Methods
- BU-401: How do Battery Chargers Work?
- BU-401a: Fast and Ultra-fast Chargers
- BU-402: What Is C-rate?
- BU-403: Charging Lead Acid
- BU-404: What is Equalizing Charge?
- BU-405: Charging with a Power Supply
- BU-406: Battery as a Buffer
- BU-407: Charging Nickel-cadmium
- BU-408: Charging Nickel-metal-hydride
- BU-409: Charging Lithium-ion
- BU-409a: Why do Old Li-ion Batteries Take Long to Charge?
- BU-409b: Charging Lithium Iron Phosphate
- BU-410: Charging at High and Low Temperatures
- BU-411: Charging from a USB Port
- BU-412: Charging without Wires
- BU-413: Charging with Solar, Turbine
- BU-413a: How to Store Renewable Energy in a Battery
- BU-414: How do Charger Chips Work?
- BU-415: How to Charge and When to Charge?
-
Discharge Methods
- BU-501: Basics about Discharging
- BU-501a: Discharge Characteristics of Li-ion
- BU-502: Discharging at High and Low Temperatures
- BU-503: Determining Power Deliver by the Ragone Plot
- BU-504: How to Verify Sufficient Battery Capacity
-
"Smart" Battery
- BU-601: How does a Smart Battery Work?
- BU-602: How does a Battery Fuel Gauge Work?
- BU-603: How to Calibrate a “Smart” Battery
- BU-603a: Calibrating SMBus Batteries with Impedance Tracking
- BU-604: How to Process Data from a “Smart” Battery
- BU-605: Testing and Calibrating Smart Batteries
-
From Birth to Retirement
- BU-701: How to Prime Batteries
- BU-702: How to Store Batteries
- BU-703: Health Concerns with Batteries
- BU-704: How to Transport Batteries
- BU-704a: Shipping Lithium-based Batteries by Air
- BU-704b: CAUTION & Overpack Labels
- BU-704c: Class 9 Label
- BU-704d: NFPA 704 Rating
- BU-704e: Battery for Personal and Fleet Use
- BU-705: How to Recycle Batteries
- BU-705a: Battery Recycling as a Business
- BU-706: Summary of Do's and Don'ts
-
How To Prolong Battery Life
-
General
- BU-801: Setting Battery Performance Standards
- BU-801a: How to Rate Battery Runtime
- BU-801b: How to Define Battery Life
- BU-802: What Causes Capacity Loss?
- BU-802a: How does Rising Internal Resistance affect Performance?
- BU-802b: What does Elevated Self-discharge Do?
- BU-802c: How Low can a Battery be Discharged?
- BU-803: Can Batteries Be Restored?
- BU-803a: Cell Matching and Balancing
- BU-803b: What causes Cells to Short?
- BU-803c: Loss of Electrolyte
-
Lead Acid
- BU-804: How to Prolong Lead-acid Batteries
- BU-804a: Corrosion, Shedding and Internal Short
- BU-804b: Sulfation and How to Prevent it
- BU-804c: Acid Stratification and Surface Charge
- BU-805: Additives to Boost Flooded Lead Acid
- BU-806: Tracking Battery Capacity and Resistance as part of Aging
- BU-806a: How Heat and Loading affect Battery Life
-
Nickel-based
- BU-807: How to Restore Nickel-based Batteries
- BU-807a: Effect of Zapping
-
Lithium-ion
- BU-808: How to Prolong Lithium-based Batteries
- BU-808a: How to Awaken a Sleeping Li-ion
- BU-808b: What Causes Li-ion to Die?
- BU-808c: Coulombic and Energy Efficiency with the Battery
- BU-809: How to Maximize Runtime
- BU-810: What Everyone Should Know About Aftermarket Batteries
- BU-811: Assuring Minimum Operational Reserve Energy (MORE)
-
Battery Testing and Monitoring
- BU-901: Fundamentals in Battery Testing
- BU-901b: How to Measure the Remaining Useful Life of a Battery
- BU-902: How to Measure Internal Resistance
- BU-902a: How to Measure CCA
- BU-903: How to Measure State-of-charge
- BU-904: How to Measure Capacity
- BU-905: Testing Lead Acid Batteries
- BU-905a: Testing Starter Batteries in Vehicles
- BU-905b: Knowing when to Replace a Starter Battery
- BU-906: Testing Nickel-based Batteries
- BU-907: Testing Lithium-based Batteries
- BU-907a: Battery Rapid-test Methods
- BU-907b: Advancements in Battery Testing
- BU-907c: Cloud Analytics in Batteries
- BU-908: Battery Management System (BMS)
- BU-909: Battery Test Equipment
- BU-910: How to Repair a Battery Pack
- BU-911: How to Repair a Laptop Battery
- BU-915: Testing Battery with EIS
- BU-916: Deep Battery Diagnostics
- BU-917: In Search for Performance Transparency with Batteries
- BU-918: Battery Endurance Plan
- BU-919: Building a Matrix to test Batteries
- BU-920: Matrix Library
- BU-921: Testing Batteries by Multi-Model EIS
- BU-922: What Causes Starter Batteries to Fail?
- BU-923: Getting Deep Cycle Batteries Mission Ready
- BU-924: Battery Ecosystem
- BU-925: EIS Direct Drive, non-invasive Capacity Test
- BU-926: Battery Diagnostics, an Overlooked Requirement
-
Amazing Value of a Battery
- BU-1001: Batteries in Industries
- BU-1002: Electric Powertrain, then and now
- BU-1002a: Hybrid Electric Vehicles and the Battery
- BU-1002b: Environmental Benefit of the Electric Powertrain
- BU-1003: Electric Vehicle (EV)
- BU-1003a: Battery Aging in an Electric Vehicle (EV)
- BU-1004: Charging an Electric Vehicle
- BU-1005: Does the Fuel Cell-powered Vehicle have a Future?
- BU-1006: Cost of Mobile and Renewable Power
- BU-1007: Net Calorific Value
- BU-1008: Working towards Sustainability
- BU-1009: Battery Paradox - Afterword
-
Information
- BU-1101: Glossary
- BU-1102: Abbreviations
- BU-1103: Bibliography
- BU-1104: About the Author
- BU-1105: About Cadex (Sponsor)
- BU-1106: Author's Creed
- BU-1107: Disclaimer
- BU-1108: Copyright
-
Learning Tools
- BU-1501 Battery History
- BU-1502 Basics about Batteries
- BU-1504 Battery Test and Analyzing Devices
- BU-1505 Short History of Cadex
-
Battery Articles
- Perception of a Battery Tester
- Green Deal
- Risk Management in Batteries
- Predictive Test Methods for Starter Batteries
- Why Mobile Phone Batteries do not last as long as an EV Battery
- Battery Rapid-test Methods
- How to Charge Li-ion with a Parasitic Load
- Ultra-fast Charging
- Assuring Safety of Lithium-ion in the Workforce
- Diagnostic Battery Management
- Tweaking the Mobile Phone Battery
- Battery Test Methods
- Battery Testing and Safety
- How to Make Battery Performance Transparent
- Battery Diagnostics On-the-fly
- Making Battery State-of-health Transparent
- Batteries will eventually die, but when and how?
- Why does Pokémon Go rob so much Battery Power?
- How to Care for the Battery
- Tesla’s iPhone Moment — How the Powerwall will Change Global Energy Use
- Painting the Battery Green by giving it a Second Life
- Charging without Wires — A Solution or Laziness
- What everyone should know about Battery Chargers
- A Look at Cell Formats and how to Build a good Battery
- Battery Breakthroughs — Myth or Fact?
- Rapid-test Methods that No Longer Work
- Shipping Lithium-based Batteries by Air
- How to make Batteries more Reliable and Longer Lasting
- What causes Lithium-ion to die?
- Safety of Lithium-ion Batteries
- Recognizing Battery Capacity as the Missing Link
- Managing Batteries for Warehouse Logistics
- Caring for your Starter Battery
- Giving Batteries a Second Life
- How to Make Batteries in Medical Devices More Reliable
- Possible Solutions for the Battery Problem on the Boeing 787
- Impedance Spectroscopy Checks Battery Capacity in 15 Seconds
- How to Improve the Battery Fuel Gauge
- Examining Loading Characteristics on Primary and Secondary Batteries
-
Language Pool
- BU-001: Compartir conocimiento sobre baterías
- BU-002: Introducción
- BU-003: Dedicatoria
- BU-104: Conociendo la Batería
- BU-302: Configuraciones de Baterías en Serie y Paralelo
-
Batteries in a Portable World book
- Change-log of “Batteries in a Portable World,” 4th edition: Chapters 1 - 3
- Change-log of “Batteries in a Portable World,” 4th edition: Chapters 4 - 10