
With the large number of lithium-ion batteries in use and the applications growing, a functional rapid-testing method is becoming a necessity. Several attempts have been tried, including measuring internal resistance, and the results have been mixed. Additives keep the internal resistance of modern Li-ion low throughout most of the life, making ohmic test unreliable. The internal resistance is measured either by the AC or DC method. Both provide different reading(See BU-802a: How does Rising Internal Resistance affect Performance?)
Electrochemical dynamic response, the method QuickSort™ uses, measures the mobility of ion flow between the electrodes. Based on time domain analysis by applying brief load pulses, the response time on attack and recovery is measured; an algorithm computes the results and compares them against a set of parameters. As seen in Figure 1, a good battery resists the attack and recovers quickly whereas the impact of a weaker battery is larger and the recovery is slower. Figure 1 illustrates the concept of the technology.
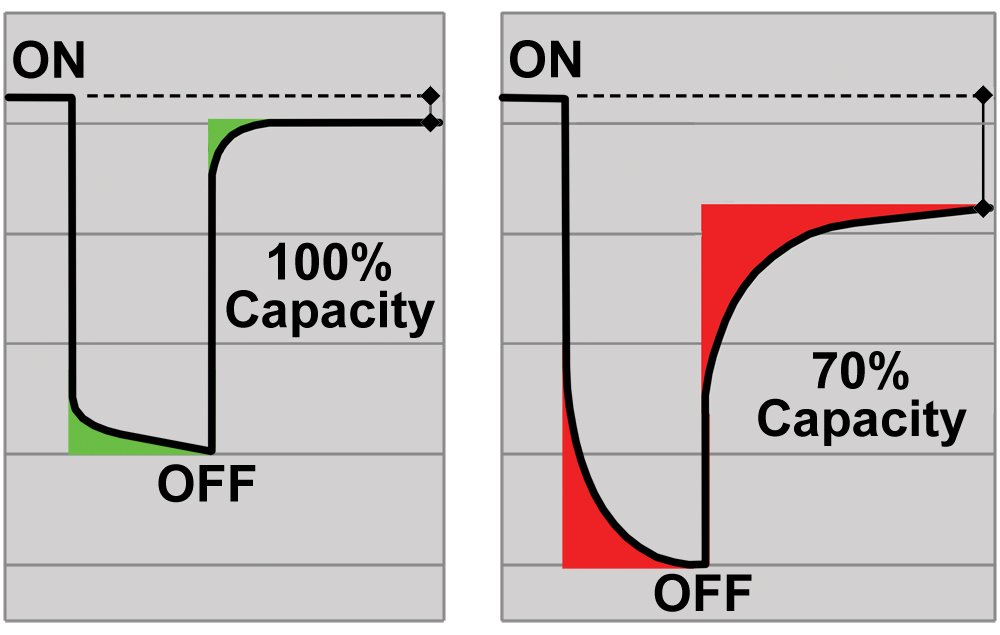
The electrochemical dynamic response measures the ion flow between the positive and negative plates. A strong battery recovers quickly from an attack whereas a weaker pack behaves more sluggishly.
Lithium-ion batteries have different diffusion rates. In terms of electrochemical dynamic response, Li-ion polymer with gelled electrolyte is found to be faster than standard Li-ion and needs modified parameters to achieve accuracy. Unique active materials and additives that are kept top secret by battery manufacturers complicate the test procedure.
Cadex devoted much effort to testing small single Li-ion cell in mobile phones. The objective is to also test larger Li-ion in multi-cell configuration, over a broad range of state-of-charge, which involves combining time domain test with frequency domain.
When scanning a battery from kilohertz down to millihertz in frequency domain mode, the high frequency range called migration reveals the resistive qualities of a battery that present a bird’s-eye view of the landscape. However, the unique characteristics of Li-ion lie in the mid frequency range called charge transfer and the low range dubbed diffusion. Batteries with faded capacity suffer from low charge transfer and slow active Li-ion diffusion.
Evaluating batteries at sub one-hertz frequency would require prolonged test times. At one millihertz, for example, one cycle takes 1,000 seconds, or 16 minutes, and several data points are required to complete the analysis. Rapid-tests should only last a few seconds and not longer than 5 minutes. With clever software simulation, the duration can be shortened to fall within the desired short test time.
In Figure 2, a good battery and a faded battery are scanned from 0.1Hz to 1kHz. The difference in impedance (-Imp -Z) is strongest between 1Hz and 10Hz. It should be noted that capturing resistive readings alone has limited value as state-of-charge (SoC) and temperature also affect the signature and muddle SoH references. Furthermore, different Li-ion architectures and how the battery has aged also affect the results. Natural aging produces a different signature than artificial aging and the reason for this discrepancy is not fully understood.
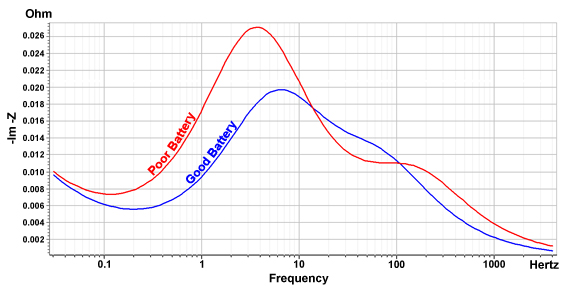
Impedance variances are most visible below 10Hz. The horizontal scale is logarithmic to condense the frequency range.
Test results captured by frequency domain are best represented by the Nyquist plot. Invented by Harry Nyquist (1889–1976) while at Bell Laboratories; a Nyquist plot presents the frequency response of a linear systems displaying both amplitude and phase angle on a single plot using frequency as parameter. The horizontal x axis of a Nyquist plot reveals the real Ohm impedance while the vertical y axis represents the imaginary impedance(Impedance is explained on BU-902: How to Measure Internal Resistance)
Figure 3 divides the scanned battery results as delivered by the Nyquist plot into migration, charge transfer and diffusion. Migration derived at high frequency on the left provides resistive characteristics of a battery; the all-important charge transfer in the middle forms a semi-circle that represents the kinetics of the battery; and the low frequency part on the right represents diffusion.
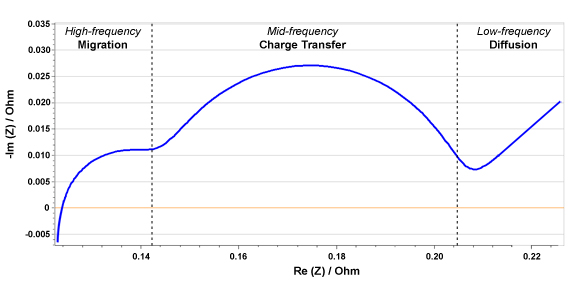
The mid-frequency semi-circle represents battery characteristics best. Larger batteries require lower frequencies.
A rapid-test should last from a few seconds to no more than 5 minutes, but applying ultra-low frequencies prolongs time. For example, at one millihertz (mHz), one cycle takes 1,000 seconds, or 16 minutes, and several data points are required to complete the analysis. Test durations can often be shortened with clever software simulation.
Li-ion shares similarities with lead acid; the Spectro™ technology that is used to measure the capacity of lead acid batteries will also be able to service Li-ion(See BU-904: How to Measure Capacity)
Summary
No rapid-test can evaluate all battery symptoms and there are always outliers that defy the test protocol. Correct prediction should be 9 out of 10. QuickSort™ (by Cadex) exceeds this requirement with most Li-ion packs for mobile phones, but this technology only tests single-cell packs up to 1,500mAh. New technologies in development promise to test larger Li-ion packs, but this may extend the test to a few minutes to accommodate low frequency sampling.
Capacity is the gate keeper to battery health, and rapid-test technologies with capacity estimation also enhance battery management systems (BMS). Such rapid-test technologies can be included in chargers to evaluate the integrity of the battery with each charge by giving the green ready light only if the set target capacity is met; low capacity batteries are shown the backdoor. This provides quality control without adding an extra layer of overhead.
References
[1] J. Tinnemeyer and Z. Carlin, "Pulse-discharge battery testing methods and apparatus". US Patent US7622929B2, 25 07 2006.
[2] Courtesy of Cadex
Last Updated: 4-Nov-2021

Batteries In A Portable World
Looking for comments from the previous website?
Comments from the previous website are not compatible with our new commenting system but we have preserved them so our users can still reference and make use the information in them.
Show Old Comments
On August 19, 2019, abdulbadii wrote:
Can you point us out how to test a Li-ion battery much more practically, less theoraticaly please ?
On October 8, 2018, sundari wrote:
I need to test my 18650 cylindrical lithium ion cell (4.2V,3.5Ah) to find out the cell parameters.could you please tell me which test is easy to find out those parameter values Thank you
On July 23, 2018, Radhouene wrote:
Hello, I am Radhouene, I work on Li-ion battery technology (I am new in this field), please, I have some questions to start the manufacture of cell corner prototypes and also 18650 cell and test them: 1) First of all, what are the necessary equipment to use for this technology (according to my research I find many machines and products on everything for the anodes and cathodes)? 2) What is the quantity of material (mass) to be used to maintain the anode (Cu), cathode (Al)? I am very grateful, if someone send me documents or offer some details on this technology. Thank you very much.
On April 16, 2018, Donatella Romain wrote:
If you are looking for french batterie you can visit this site: www.velobatterie.fr
On April 11, 2018, Peter Sutter wrote:
Re-used Li-Ion batteries. I got a number of laptop batteries which I disassembled. The cells are rated at 2500mAH. Each cell I charged individually and then discharged to get its remaining capacity. The cells were either 'dead' (4 out of 50), surprisingly, the 'undead' (46) have all a capacity of more than 2000mAH left. I would like to make a 10.8V 30AH pack of the recycled ones. (3 series 15 parallel). What is the better way of doing this, 1. either use the existing battery managers and make individual 10.8V 4AH (3 series 2 parallel) packs of these and connect these packs in parallel 2. or do I make a pack of 3 Series 15 Parallel and buy a new 10.8V 25 A battery manager.
On March 27, 2018, andrew wrote:
Hi there.. i am hoping that you can help me. i am designing a product that will include a Lithium Polymer Battery. the product will be manufactured in china and the battery will also be sourced from china. the battery will be a 1400mAh Li-ion Polymer battery. my question is, do i need to get the battery certified and checked to ensure that it passes any safety regulations? if so, please can you advise of how i go about doing this in the UK
On February 24, 2018, David wrote:
I have a 26.2 v 11.25ah for my travel scoot scooter, it is approximately 7 yr old lately it does not last as long as it once did. It contains 35 CGR18650CG li-on batteries w/a built-in board. Mfg by Mobile Energy Technologies LTD. In Taiwan. Can I check the individual cells, how, and is there a company that rebuilds battery packs? I am disabled an like my scooter, new battery pack costs 600-700 dollars.
On September 6, 2017, Halmat wrote:
How i am testing for amps my bike battery lithium ion 36v5amp
On May 14, 2017, Anita wrote:
To Will yes if you have the proper tools! you need to charge the battery, open the battery pack, put a load like 5A monitor each cell voltage, you will find one group with lower voltage than other group then to replace only these cells, you need the jig, the welder.... not a simple thing it may be better to look in your local ads, for aa battery rebuilder
On May 14, 2017, Anita wrote:
To Mahesh Lipare check Cadex C5100B analyzer (contact them) and westmountainradio.com/cba
On January 9, 2017, Will Rigdon wrote:
One of the best inexpensive battery chargers that can be purchased and used for common tests to measure battery capacity; http://www.westmountainradio.com/cba.php
On August 9, 2016, Jamy Stevan wrote:
I have read a bunch of the articles. One of them mentioned that almost all of the batteries were tested. I would very much like to see that chart. Would someone be able to provide that for me? Thank you, Jamy
On May 7, 2016, Mahesh Lipare wrote:
I want to buy 48V 20AH Li Ion battery tester. Which can tell us battery capacity , battery life ,cycle uses remaining etc... Can some one help me by suggesting appropriate instrument ?
On May 3, 2016, Ken wrote:
To load pack you can use halogen light bulbs. Like construction lights. Use Ammeter to find draw and calculate wattage load. Charge you pack first then measure and individual cells under load. Eventually one will trip the BMS. I posted earlier in this thread how to calculate internal resistance. You'll need to replace the bad cell(s)
On May 2, 2016, Will wrote:
I have a 36v 16 Ah Li-ion battery on my ebike. Last season, I unintentionally let the battery discharge fully. Thereafter/now, the battery only provides 2/3 of the maximum velocity to the bike that the battery once provided. Is there a way to measure the battery's performance under load at home? Thanks for any suggestions, assistance you can provide
On December 12, 2015, Monte wrote:
I too would like to be able to test a 48V 20Ah Li-ion battery for an electric bike. I have no idea if the seller is selling me something he has already used half the life of...is there a way to find out how many useful charge cycles a Li-ion battery has left in it? I don't want to buy an oscilloscope with a serial port and run diagnostics...but if that's the only way...
On August 14, 2015, casiopusat wrote:
they are an important articles. how i get to know poor battery
On June 24, 2015, Graham wrote:
I need to test mobility scooter 24v 10Ah lithium polmer battery packs, could anyone please recommend a suitable tester that can be purchased or made Thank you
On December 10, 2014, Robert Dierker wrote:
Hello. I would like to make a tester for Li-Ion bicycle batteries. They are 48v 10Ah. Also, what are optimal inventory storage characteristics for the same battery? Thank you.
On November 25, 2014, Edward wrote:
Robbert, Do you mean the consumer laptop battery packs ? that is difficult, it is the same specification? please email to me for more deatil information zzrm316@163.com maybe you need the model to charge
On November 24, 2014, Robbert Uiterloo wrote:
I purchased approx 1000 Li-ion laptop battery packs from different laptops for re-sale. I need to charge them but do not have a charger. What do you recommend?
On November 5, 2014, MD. HAFIZUR RAHMAN wrote:
Battery that can be charged only by water or any liquid things for long time
On October 21, 2014, Ken Bell wrote:
I measure voltage sag under load. The capacity and health can be quickly determined by the internal resistance, delta V/I when compared to a new cell. An old cell, measured across the power range from 0 to 1C will have a much less linear profile than a new cell.
On October 14, 2014, Lynn Marie Hicks wrote:
I have a Li-ion 14.4V 5200mAh 416996-131 for an HpDV9700 laptop computer. It does not hold a charge. Is there any thing else I can do short of replacing the battery? Is there a way to reset the charge?
On July 15, 2014, Edward wrote:
Dear all I am the battery engineer in a Lithium company ,if you have any problem about the battery, please email to me zzrm316@163.com Edward
On July 2, 2014, Lena wrote:
Could you elaborate a little bit more on "QuickSort™ requires the correct mAh, and setting a wrong value does not shift the reading on a linear scale from good to poor, as one would expect, but makes the sorting less accurate. " How does the operator know that mAh is correct? Is there a way to know the correct mAh before the measurement?
On May 30, 2014, paul wrote:
i have a Li- Ion type J1KND 11.1 v capacity 48 Wh battery in a inspiron dell computer that once a disconnect the power cable it shows me that the battery needs to be replace and it starts to discharge very fast , how do i test this battery to see if it really needs to be replace ? or maybe you know of a technique to get this battery to the original state when i bought it . your inputs are very appreciated thanks
On May 28, 2014, AIMORE DUTRA NETO wrote:
I´m sorry it is size D
On May 28, 2014, AIMORE DUTRA NETO wrote:
Hi! I need to test size A batteries LiSOCl2. Any suggestions will be very appreciated. Thank you.
On April 22, 2014, naga rajum wrote:
what is the relation between charging time, voltage , capacity, charging current in lithium ion rechargeable battery. suppose how much time it will take 6000mah battery charging with 100mA with 4.2 volts.
On October 15, 2013, Tayelolu pelumi wrote:
On May 28, 2013, praveen wrote:
Normally, the Li polymer batteries life cannot be determined based on its cycles, and moreover the Li- polymer batteries are more sensitive to over voltage while charging and under voltage while while discharge, it also depends on the operating temperature as well. I also suggest you to check the battery protection unit before replacing the battery.
On December 5, 2012, Simon Lodewijks wrote:
I have cycled close to 2000 miles on my `Hebb 700 e-bike, which has a 37V 14 amp LI-Polymer battery. Just discovered through self diagnostic testing light that battery voltage is above 44V and that battery should be replaced My question; Is it normal for the above mentioned battery to have lasted only 18 months, it has not even used half of it's promoted cycles? Looking forward to your response, Simon Lodewijks
What is currently available or in development to test 12V nominal (12.8V?) lithium-ion batteries like those used by Tesla as the "storage" battery in electric vehicles. The small conventional battery (AGM in many cases) is critical to maintaining some vehicle systems while the traction pack battery is disconnected during vehicle off conditions. When the small battery goes flat, it's a problem. How to field test this Lithium-type battery?