BU-915: Testing Battery with EIS

New technologies often lead to “innovative blind spots,” and this is happening with electrification in batteries. Lithium-ion is a winning chemistry to store electrical energy but there is fear of failure that often starts in a faulty cell that propagates and engulfs the battery in fire. Such incidents are known with e-bike batteries and other devices.
Cadex is developing a technology that reads the electrochemical evidence of a battery with a frequency scan and displays the results in a Nyquist plot. Figure 1 demonstrates Nyquist plots taken from 100 high-quality 8650 Li-ion cells with Spectro Explore.

Figure 1: Nyquist plots of 100 18650 cells for quality control. Test was done in a controlled environment
The Spectro Explorer services Li-ion and lead acid batteries from 3V to 48V with capacities of up to 300Ah. The test is minimally-invasive with a frequency scan from 2,000Hz down to 0.1Hz that takes about 30 seconds; longer for large batteries. Applications for the Explorer are quality control in manufacturing, examining uniformity of incoming batteries, and battery validation before shipment. Best results are achieved with preparations such as a prior full charge, followed by a short rest.
Dormant lead acid batteries develop sulfation, a deficiency that can be removed with exercise if the sulfation is soft. Hard sulfation that occurs during long dormancy at low charge can be permanent.
Primary lithium batteries also develop passivation while in storage as illustrated in BU-701: How to Prime Batteries (Figure 2). The passivation layer is removable with a brief discharge. These are added services that a Nyquist scan can discover.

Figure 2: Nyquist serves as golden sample with acceptance tolerances
What is a Nyquist Plot?
A Nyquist plot consists of a resistive reading (Real Z) that is positioned on the horizontal axis, and a reactive analysis placed on the vertical axis. The resulting signature reflecting battery characteristics is divided into migration at high frequency on the left of the scale; charge transfer in mid-range; and diffusion at low frequencies on the right.
Figure 2 illustrates a Nyquist plot serving as “golden sample” with adjustable pass/fail envelopes to set acceptance levels for quality control in manufacturing and performance check before deployment.
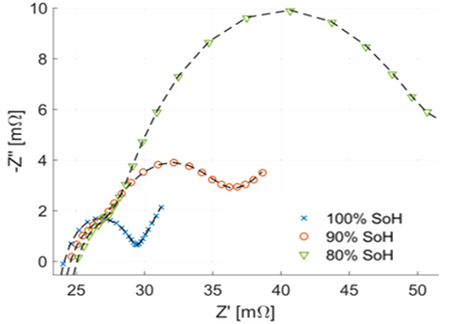
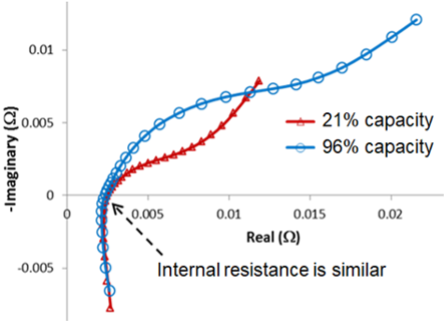
Figure 3 compares Nyquist plots with different battery performances, Figure 4 overlays a Nyquist plot of a good battery with one of low capacity and Figure 5 illustrates a battery with dendrite growth. Figure 6 compares Nyquist signature of aged lead acid batteries with sulfated packs. Unless otherwise noted all readings were taken at the Cadex labs in Canada and Germany.
 |  |
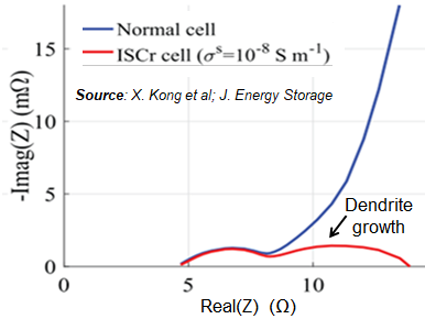 | 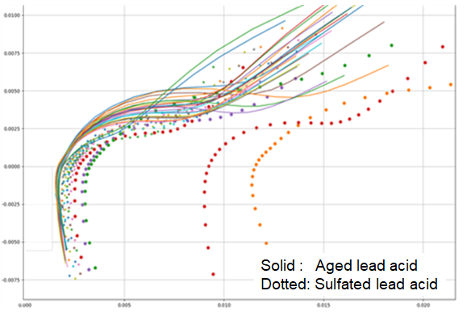 |

Figure 7: Exercise improved capacity from 75% to 92%
Lead acid batteries stored for six months or longer develop sulfation; a dormancy effect that reduces performance but is reversible by exercise if done in time. Figure 7 shows the Nyquist plots of a lead acid battery that had a low charge transfer with a capacity reading of 75% when first serviced. After exercise with a charge/discharge cycle, charge acceptance improved and the capacity increased to 92%. Other lead acid batteries tested with various dormancy effects had similar improvements. More studies are needed in how the Nyquist can identify sulfation that lead to restoration

Figure 8: EIS test on an e-bike battery. The 40V pack has 4 cells in parallel and 10 pairs in series

Figure 9: Comparison test of four e-bike batteries with various deficiencies.
We now scan batteries with the Explorer in an entire pack, as well as in parallel pairs. Figure 8 shows an open e-bike battery; Figures 9, 10 and 11 show the test results.
With acquired knowledge, a Nyquist plot can easily be deciphered by technical staff. The task is simplified by comparing a faulty pack with a good one, knows as golden sample.
As Figure 9 illustrates, a normal pack has a small footprint that is contained in the user-adjustable Acceptance Field, while a faulty battery steps outside set limits. The shapes of the “cat tails” may one day lead to identifying the nature of defect.

Figure 10: Cells in good pairs are contained in a small circle; a shorted cell in a parallel pair enlarges the Nyquist plot.
Figure 10 shows an entire pack with one cell shorted. The graph also does a comparison with a parallel pair in which all cells are good as shown in the small oval. Adding one bad apple changes the order.
Protection circuit and series connections add non-reactive resistance that shift the Nyquist plot of the pack to the right.

Figure 11: Effect of protection circuit
Blue: Protection circuit bypassed
Red: Includes protection circuit through connector with short cable
Green: Includes protection circuit with long cable
Mixing non-reactive resistance with the reactive component of a battery is further exemplified in Figure 11. Here the protection circuit and long cables move the Nyquist plot to the right while retaining the signature of the Nyquist plot. The shift reflects the pure resistive part of the battery that will also assist in troubleshooting.
Conclusion
Testing batteries by EIS is not new, but scientists predict that future battery diagnostics rests in EIS analysis. Evaluation by Nyquist using the Spectro Explorer has the potential of becoming a household name, led by versatility, ease of use and low cost. Using these technologies will reduce innovative blind spots to maintain safety as the world electrifies with batteries. Typical EIS applications include:

Figure 12: Spectro Explorer
- Research Labs: Checks cathode and anode materials with additives.
- Manufacturing: Evaluates consistency between battery batches.
- Quality Control: Verifies incoming batteries and warranty claims.
- Environmental: Tests battery aging under extreme temperatures.
- Stress Test: Observes capacity-loss under abusive load conditions.
- Safety: Detects dendrites and lithium plating in a integrity check
According to the UL Research Institute, thermal runaway is a primary cause of fire in Li-ion.
Last Updated: 23-Jan-2024

Batteries In A Portable World
The material on Battery University is based on the indispensable new 4th edition of "Batteries in a Portable World - A Handbook on Rechargeable Batteries for Non-Engineers" which is available for order through Amazon.com.
Find An Article
Table of Contents
-
Introduction
- BU-001: Sharing Battery Knowledge
- BU-002: Introduction
- BU-003: Dedication
-
Crash Course on Batteries
- BU-101: When Was the Battery Invented?
- BU-102: Early Innovators
- BU-103: Global Battery Markets
- BU-103a: Battery Breakthroughs: Myth or Fact?
- BU-104: Getting to Know the Battery
- BU-104a: Comparing the Battery with Other Power Sources
- BU-104b: Battery Building Blocks
- BU-104c: The Octagon Battery – What makes a Battery a Battery
- BU-105: Battery Definitions and what they mean
- BU-106: Advantages of Primary Batteries
- BU-106a: Choices of Primary Batteries
- BU-107: Comparison Table of Secondary Batteries
-
Battery Types
- BU-201: How does the Lead Acid Battery Work?
- BU-201a: Absorbent Glass Mat (AGM)
- BU-201b: Gel Lead Acid Battery
- BU-202: New Lead Acid Systems
- BU-203: Nickel-based Batteries
- BU-204: How do Lithium Batteries Work?
- BU-205: Types of Lithium-ion
- BU-206: Lithium-polymer: Substance or Hype?
- BU-208: Cycling Performance
- BU-209: How does a Supercapacitor Work?
- BU-210: How does the Fuel Cell Work?
- BU-210a: Why does Sodium-sulfur need to be heated
- BU-210b: How does the Flow Battery Work?
- BU-211: Alternate Battery Systems
- BU-212: Future Batteries
- BU-214: Summary Table of Lead-based Batteries
- BU-215: Summary Table of Nickel-based Batteries
- BU-216: Summary Table of Lithium-based Batteries
- BU-217: Summary Table of Alternate Batteries
- BU-218: Summary Table of Future Batteries
-
Packaging and Safety
- BU-301: A look at Old and New Battery Packaging
- BU-301a: Types of Battery Cells
- BU-302: Series and Parallel Battery Configurations
- BU-303: Confusion with Voltages
- BU-304: Why are Protection Circuits Needed?
- BU-304a: Safety Concerns with Li-ion
- BU-304b: Making Lithium-ion Safe
- BU-304c: Battery Safety in Public
- BU-305: Building a Lithium-ion Pack
- BU-306: What is the Function of the Separator?
- BU-307: How does Electrolyte Work?
- BU-308: Availability of Lithium
- BU-309: How does Graphite Work in Li-ion?
- BU-310: How does Cobalt Work in Li-ion?
- BU-311: Battery Raw Materials
-
Charge Methods
- BU-401: How do Battery Chargers Work?
- BU-401a: Fast and Ultra-fast Chargers
- BU-402: What Is C-rate?
- BU-403: Charging Lead Acid
- BU-404: What is Equalizing Charge?
- BU-405: Charging with a Power Supply
- BU-406: Battery as a Buffer
- BU-407: Charging Nickel-cadmium
- BU-408: Charging Nickel-metal-hydride
- BU-409: Charging Lithium-ion
- BU-409a: Why do Old Li-ion Batteries Take Long to Charge?
- BU-409b: Charging Lithium Iron Phosphate
- BU-410: Charging at High and Low Temperatures
- BU-411: Charging from a USB Port
- BU-412: Charging without Wires
- BU-413: Charging with Solar, Turbine
- BU-413a: How to Store Renewable Energy in a Battery
- BU-414: How do Charger Chips Work?
- BU-415: How to Charge and When to Charge?
-
Discharge Methods
- BU-501: Basics about Discharging
- BU-501a: Discharge Characteristics of Li-ion
- BU-502: Discharging at High and Low Temperatures
- BU-503: Determining Power Deliver by the Ragone Plot
- BU-504: How to Verify Sufficient Battery Capacity
-
"Smart" Battery
- BU-601: How does a Smart Battery Work?
- BU-602: How does a Battery Fuel Gauge Work?
- BU-603: How to Calibrate a “Smart” Battery
- BU-603a: Calibrating SMBus Batteries with Impedance Tracking
- BU-604: How to Process Data from a “Smart” Battery
- BU-605: Testing and Calibrating Smart Batteries
-
From Birth to Retirement
- BU-701: How to Prime Batteries
- BU-702: How to Store Batteries
- BU-703: Health Concerns with Batteries
- BU-704: How to Transport Batteries
- BU-704a: Shipping Lithium-based Batteries by Air
- BU-704b: CAUTION & Overpack Labels
- BU-704c: Class 9 Label
- BU-704d: NFPA 704 Rating
- BU-704e: Battery for Personal and Fleet Use
- BU-705: How to Recycle Batteries
- BU-705a: Battery Recycling as a Business
- BU-706: Summary of Do's and Don'ts
-
How To Prolong Battery Life
-
General
- BU-801: Setting Battery Performance Standards
- BU-801a: How to Rate Battery Runtime
- BU-801b: How to Define Battery Life
- BU-802: What Causes Capacity Loss?
- BU-802a: How does Rising Internal Resistance affect Performance?
- BU-802b: What does Elevated Self-discharge Do?
- BU-802c: How Low can a Battery be Discharged?
- BU-803: Can Batteries Be Restored?
- BU-803a: Cell Matching and Balancing
- BU-803b: What causes Cells to Short?
- BU-803c: Loss of Electrolyte
-
Lead Acid
- BU-804: How to Prolong Lead-acid Batteries
- BU-804a: Corrosion, Shedding and Internal Short
- BU-804b: Sulfation and How to Prevent it
- BU-804c: Acid Stratification and Surface Charge
- BU-805: Additives to Boost Flooded Lead Acid
- BU-806: Tracking Battery Capacity and Resistance as part of Aging
- BU-806a: How Heat and Loading affect Battery Life
-
Nickel-based
- BU-807: How to Restore Nickel-based Batteries
- BU-807a: Effect of Zapping
-
Lithium-ion
- BU-808: How to Prolong Lithium-based Batteries
- BU-808a: How to Awaken a Sleeping Li-ion
- BU-808b: What Causes Li-ion to Die?
- BU-808c: Coulombic and Energy Efficiency with the Battery
- BU-809: How to Maximize Runtime
- BU-810: What Everyone Should Know About Aftermarket Batteries
- BU-811: Assuring Minimum Operational Reserve Energy (MORE)
-
Battery Testing and Monitoring
- BU-901: Fundamentals in Battery Testing
- BU-901b: How to Measure the Remaining Useful Life of a Battery
- BU-902: How to Measure Internal Resistance
- BU-902a: How to Measure CCA
- BU-903: How to Measure State-of-charge
- BU-904: How to Measure Capacity
- BU-905: Testing Lead Acid Batteries
- BU-905a: Testing Starter Batteries in Vehicles
- BU-905b: Knowing when to Replace a Starter Battery
- BU-906: Testing Nickel-based Batteries
- BU-907: Testing Lithium-based Batteries
- BU-907a: Battery Rapid-test Methods
- BU-907b: Advancements in Battery Testing
- BU-907c: Cloud Analytics in Batteries
- BU-908: Battery Management System (BMS)
- BU-909: Battery Test Equipment
- BU-910: How to Repair a Battery Pack
- BU-911: How to Repair a Laptop Battery
- BU-915: Testing Battery with EIS
- BU-916: Deep Battery Diagnostics
- BU-917: In Search for Performance Transparency with Batteries
- BU-918: Battery Endurance Plan
- BU-919: Building a Matrix to test Batteries
- BU-920: Matrix Library
- BU-921: Testing Batteries by Multi-Model EIS
- BU-922: What Causes Starter Batteries to Fail?
- BU-923: Getting Deep Cycle Batteries Mission Ready
- BU-924: Battery Ecosystem
- BU-925: EIS Direct Drive, non-invasive Capacity Test
- BU-926: Battery Diagnostics, an Overlooked Requirement
-
Amazing Value of a Battery
- BU-1001: Batteries in Industries
- BU-1002: Electric Powertrain, then and now
- BU-1002a: Hybrid Electric Vehicles and the Battery
- BU-1002b: Environmental Benefit of the Electric Powertrain
- BU-1003: Electric Vehicle (EV)
- BU-1003a: Battery Aging in an Electric Vehicle (EV)
- BU-1004: Charging an Electric Vehicle
- BU-1005: Does the Fuel Cell-powered Vehicle have a Future?
- BU-1006: Cost of Mobile and Renewable Power
- BU-1007: Net Calorific Value
- BU-1008: Working towards Sustainability
- BU-1009: Battery Paradox - Afterword
-
Information
- BU-1101: Glossary
- BU-1102: Abbreviations
- BU-1103: Bibliography
- BU-1104: About the Author
- BU-1105: About Cadex (Sponsor)
- BU-1106: Author's Creed
- BU-1107: Disclaimer
- BU-1108: Copyright
-
Learning Tools
- BU-1501 Battery History
- BU-1502 Basics about Batteries
- BU-1504 Battery Test and Analyzing Devices
- BU-1505 Short History of Cadex
-
Battery Articles
- Perception of a Battery Tester
- Green Deal
- Risk Management in Batteries
- Predictive Test Methods for Starter Batteries
- Why Mobile Phone Batteries do not last as long as an EV Battery
- Battery Rapid-test Methods
- How to Charge Li-ion with a Parasitic Load
- Ultra-fast Charging
- Assuring Safety of Lithium-ion in the Workforce
- Diagnostic Battery Management
- Tweaking the Mobile Phone Battery
- Battery Test Methods
- Battery Testing and Safety
- How to Make Battery Performance Transparent
- Battery Diagnostics On-the-fly
- Making Battery State-of-health Transparent
- Batteries will eventually die, but when and how?
- Why does Pokémon Go rob so much Battery Power?
- How to Care for the Battery
- Tesla’s iPhone Moment — How the Powerwall will Change Global Energy Use
- Painting the Battery Green by giving it a Second Life
- Charging without Wires — A Solution or Laziness
- What everyone should know about Battery Chargers
- A Look at Cell Formats and how to Build a good Battery
- Battery Breakthroughs — Myth or Fact?
- Rapid-test Methods that No Longer Work
- Shipping Lithium-based Batteries by Air
- How to make Batteries more Reliable and Longer Lasting
- What causes Lithium-ion to die?
- Safety of Lithium-ion Batteries
- Recognizing Battery Capacity as the Missing Link
- Managing Batteries for Warehouse Logistics
- Caring for your Starter Battery
- Giving Batteries a Second Life
- How to Make Batteries in Medical Devices More Reliable
- Possible Solutions for the Battery Problem on the Boeing 787
- Impedance Spectroscopy Checks Battery Capacity in 15 Seconds
- How to Improve the Battery Fuel Gauge
- Examining Loading Characteristics on Primary and Secondary Batteries
-
Language Pool
- BU-001: Compartir conocimiento sobre baterías
- BU-002: Introducción
- BU-003: Dedicatoria
- BU-104: Conociendo la Batería
- BU-302: Configuraciones de Baterías en Serie y Paralelo
-
Batteries in a Portable World book
- Change-log of “Batteries in a Portable World,” 4th edition: Chapters 1 - 3
- Change-log of “Batteries in a Portable World,” 4th edition: Chapters 4 - 10