BU-916: Deep Battery Diagnostics


Figure 1: Transcontinental railway in the 1800s
As the world electrifies, new demands are placed on the battery. Clean energy must have the same performance transparency as traditional power sources burning fossil fuel, but we realize that battery diagnostics is lagging behind. Without mature ways to assess battery state-of-health (SoH), battery users ask: “Will my battery die quietly or quit with a bang?”
Lesson learned reminds us of the railway tracks laid across the continent in mid-1800 that were too frail and needed replacement with double the ties to carry heavy trains traveling at high speed.
Aviation also learned a lesson with early jet travel. In the 1950s, the elegant Comet developed cracks at rivet points around window frames after 9,000 flying hours that caused the fuselage to disintegrate and the plane to crash. Reinforcement with round windows fixes the problem with modern planes.
 |
 |
Figure 2: Early passenger jets developed cracks that caused crashes
In the 1960s, industry made milestone by introducing Reliability-centered Maintenance (RCM) with strategic maintenance schedules on machinery. RCM was first applied on the Boeing 747 to improve air safety. These practices then spilled into other industries, such as nuclear plants, defense, and railways.

Figure 3: Spectro resembles face recognition
Batteries for critical uses require innovative testing to fully utilize each battery and replace them before failure. One of these test methods is electrochemical impedance spectroscopy (EIS), also known as Spectro™.
A frequency scan produces a Nyquist plot representing the electrochemical evidence of a battery. The signature is compared with a matrix of batteries of the same model with varying performances, a concept used in face recognition using AI.
The frequency scan ranging from 2,000Hz to 4Hz is minimally invasive. Test time is 30 seconds, longer with a large battery with an extended scan down to 0.1Hz.

Figure 4: Complex EIS modeling assesses capacity and CCA
The scanned data goes through filtering and magnitude extraction. Modelling and data fusion correlate the values to derive capacity, CCA, SoC and other readings. Matrices are available for lead acid and Li-ion batteries.
Capacity estimation of portable Li-ion batteries is mostly done by a System Management Bus (SMBus). With Usable Battery Energy known, the battery user must now establish the Minimum Operational Reserve Energy (MORE). Deep Battery Diagnostics (DBD) makes this possible by setting the Target Selector to a capacity threshold that delivers sufficient Leftover Charge for a given daily routine. DBD also evaluates predictive fade based on manufacturer’s specifications. Compiling the data as illustrated in Figure 5 leads to RUL, the ultimate disclosure to battery users.

Figure 5: Four-step approach tells the Remaining Useful Life of a battery
The DBD algorithm can be built into service devices, such as chargers, battery analyzers and monitoring systems serving batteries for portable, mobile, auto and stationary applications.
Modern battery chargers are no longer built to work in standalone mode. Figure 6 illustrates connecting the charger or analyzer to a host in Level 2 and Cloud Analytics in Level 3 to form a powerful battery supervisory servicing smart batteries. Capacity assessment with “dumb” batteries is also possible with the parser technology.

Figure 6: Cloud Analytics works in standalone mode, connects to a host, and stores data in the cloud.
Modern battery-care systems must be cost-effective and simple to operate. Figure 6 illustrates functions of a fully extended system starting with the lone charger. Scalability makes a battery fleet transparent with ability to set the ‘sweet spot’ between high reliability and long battery life.
 |
User: Level 1 |
 |
 |
Supervisor: Level 2 |
 |
 |
Cloud Analytics: Level 3 |
 |
Figure 7: Scalability options that can be applied in the file with CadexLink software

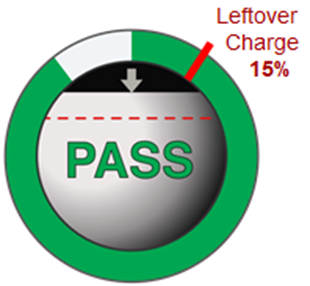
Figure 8: Fishbowl icon
The Fishbowl makes battery state-of-health transparent with Leftover Charge marked in percentage. The outer ring reveals state-of-charge that moves clock-wise with charge and counter-clockwise with discharge. The hanging black ceiling tracks capacity that slowly drops towards the set Target Selector redline as the battery ages. Touching the Status Dome displays battery data that includes battery manufacturing date, ratings, as well as cell mismatch with some smart batteries. A status message discloses the readiness of a battery.

Figure 9: Cloud Analytics with Level 3
Leftover Charge is set by the Target Selector. An analogy is an aircraft carrying enough fuel for landing.
If Leftover Charge is low, the target capacity should be set higher to increase reserve energy for a given application. If consistently high, the setting can be lowered to keep batteries in service longer.
Recommended target capacity settings of fleet batteries are:
85-90%: Critical mission; fewer batteries will pass
80%: Default; golden average that works for most uses
60-70%: Relaxed duty; batteries can be kept in service longer
Modern chargers with Target Selector may be set to different settings. For example, 90% will only pass batteries for critical uses. Once the capacity reduces, the battery is placed into the 80% charger for general use. With further fade, this battery is then kept in the 70% charger for less critical uses. Such a system lowers cost of ownership without sacrificing system reliability und lowering environmental concerns.
Conclusion
A DOE official said: “Every year roughly one million usable lithium-ion batteries are sent for recycling.” The US Army also discards tons of batteries, in part due to inactivity. Roughly 75% of vehicles on standby are driven less than 3,000 miles per year, causing battery sulfation, a film buildup that occurs when a lead acid battery is deprived of a full charge. Sulation can often be reversed if serviced in time.

Figure 10: Battery disposal yard at Kandahar Airfield
Records disclose that batteries in armored vehicles were being replaced every 13 months on average, breaking the expected life expectancy of 6 to 8 years. In fiscal 2016 alone, the Department of Defense replaced more than 373,000 batteries in a pool of 400,000 at a cost of over $80 million. (See https://asc.army.mil/web/news-alt-ond17-harnessing-the-sun/ Technology is available that assess the condition of a battery and applies corrective service to put packs back in service.
Source: U.S. Army photo by Chip Herrell,

Figure 11: Unusable vehicle batteries in Kuwait
Last Updated: 30-Jan-2024

Batteries In A Portable World
The material on Battery University is based on the indispensable new 4th edition of "Batteries in a Portable World - A Handbook on Rechargeable Batteries for Non-Engineers" which is available for order through Amazon.com.
Find An Article
Table of Contents
-
Introduction
- BU-001: Sharing Battery Knowledge
- BU-002: Introduction
- BU-003: Dedication
-
Crash Course on Batteries
- BU-101: When Was the Battery Invented?
- BU-102: Early Innovators
- BU-103: Global Battery Markets
- BU-103a: Battery Breakthroughs: Myth or Fact?
- BU-104: Getting to Know the Battery
- BU-104a: Comparing the Battery with Other Power Sources
- BU-104b: Battery Building Blocks
- BU-104c: The Octagon Battery – What makes a Battery a Battery
- BU-105: Battery Definitions and what they mean
- BU-106: Advantages of Primary Batteries
- BU-106a: Choices of Primary Batteries
- BU-107: Comparison Table of Secondary Batteries
-
Battery Types
- BU-201: How does the Lead Acid Battery Work?
- BU-201a: Absorbent Glass Mat (AGM)
- BU-201b: Gel Lead Acid Battery
- BU-202: New Lead Acid Systems
- BU-203: Nickel-based Batteries
- BU-204: How do Lithium Batteries Work?
- BU-205: Types of Lithium-ion
- BU-206: Lithium-polymer: Substance or Hype?
- BU-208: Cycling Performance
- BU-209: How does a Supercapacitor Work?
- BU-210: How does the Fuel Cell Work?
- BU-210a: Why does Sodium-sulfur need to be heated
- BU-210b: How does the Flow Battery Work?
- BU-211: Alternate Battery Systems
- BU-212: Future Batteries
- BU-214: Summary Table of Lead-based Batteries
- BU-215: Summary Table of Nickel-based Batteries
- BU-216: Summary Table of Lithium-based Batteries
- BU-217: Summary Table of Alternate Batteries
- BU-218: Summary Table of Future Batteries
-
Packaging and Safety
- BU-301: A look at Old and New Battery Packaging
- BU-301a: Types of Battery Cells
- BU-302: Series and Parallel Battery Configurations
- BU-303: Confusion with Voltages
- BU-304: Why are Protection Circuits Needed?
- BU-304a: Safety Concerns with Li-ion
- BU-304b: Making Lithium-ion Safe
- BU-304c: Battery Safety in Public
- BU-305: Building a Lithium-ion Pack
- BU-306: What is the Function of the Separator?
- BU-307: How does Electrolyte Work?
- BU-308: Availability of Lithium
- BU-309: How does Graphite Work in Li-ion?
- BU-310: How does Cobalt Work in Li-ion?
- BU-311: Battery Raw Materials
-
Charge Methods
- BU-401: How do Battery Chargers Work?
- BU-401a: Fast and Ultra-fast Chargers
- BU-402: What Is C-rate?
- BU-403: Charging Lead Acid
- BU-404: What is Equalizing Charge?
- BU-405: Charging with a Power Supply
- BU-406: Battery as a Buffer
- BU-407: Charging Nickel-cadmium
- BU-408: Charging Nickel-metal-hydride
- BU-409: Charging Lithium-ion
- BU-409a: Why do Old Li-ion Batteries Take Long to Charge?
- BU-409b: Charging Lithium Iron Phosphate
- BU-410: Charging at High and Low Temperatures
- BU-411: Charging from a USB Port
- BU-412: Charging without Wires
- BU-413: Charging with Solar, Turbine
- BU-413a: How to Store Renewable Energy in a Battery
- BU-414: How do Charger Chips Work?
- BU-415: How to Charge and When to Charge?
-
Discharge Methods
- BU-501: Basics about Discharging
- BU-501a: Discharge Characteristics of Li-ion
- BU-502: Discharging at High and Low Temperatures
- BU-503: Determining Power Deliver by the Ragone Plot
- BU-504: How to Verify Sufficient Battery Capacity
-
"Smart" Battery
- BU-601: How does a Smart Battery Work?
- BU-602: How does a Battery Fuel Gauge Work?
- BU-603: How to Calibrate a “Smart” Battery
- BU-603a: Calibrating SMBus Batteries with Impedance Tracking
- BU-604: How to Process Data from a “Smart” Battery
- BU-605: Testing and Calibrating Smart Batteries
-
From Birth to Retirement
- BU-701: How to Prime Batteries
- BU-702: How to Store Batteries
- BU-703: Health Concerns with Batteries
- BU-704: How to Transport Batteries
- BU-704a: Shipping Lithium-based Batteries by Air
- BU-704b: CAUTION & Overpack Labels
- BU-704c: Class 9 Label
- BU-704d: NFPA 704 Rating
- BU-704e: Battery for Personal and Fleet Use
- BU-705: How to Recycle Batteries
- BU-705a: Battery Recycling as a Business
- BU-706: Summary of Do's and Don'ts
-
How To Prolong Battery Life
-
General
- BU-801: Setting Battery Performance Standards
- BU-801a: How to Rate Battery Runtime
- BU-801b: How to Define Battery Life
- BU-802: What Causes Capacity Loss?
- BU-802a: How does Rising Internal Resistance affect Performance?
- BU-802b: What does Elevated Self-discharge Do?
- BU-802c: How Low can a Battery be Discharged?
- BU-803: Can Batteries Be Restored?
- BU-803a: Cell Matching and Balancing
- BU-803b: What causes Cells to Short?
- BU-803c: Loss of Electrolyte
-
Lead Acid
- BU-804: How to Prolong Lead-acid Batteries
- BU-804a: Corrosion, Shedding and Internal Short
- BU-804b: Sulfation and How to Prevent it
- BU-804c: Acid Stratification and Surface Charge
- BU-805: Additives to Boost Flooded Lead Acid
- BU-806: Tracking Battery Capacity and Resistance as part of Aging
- BU-806a: How Heat and Loading affect Battery Life
-
Nickel-based
- BU-807: How to Restore Nickel-based Batteries
- BU-807a: Effect of Zapping
-
Lithium-ion
- BU-808: How to Prolong Lithium-based Batteries
- BU-808a: How to Awaken a Sleeping Li-ion
- BU-808b: What Causes Li-ion to Die?
- BU-808c: Coulombic and Energy Efficiency with the Battery
- BU-809: How to Maximize Runtime
- BU-810: What Everyone Should Know About Aftermarket Batteries
- BU-811: Assuring Minimum Operational Reserve Energy (MORE)
-
Battery Testing and Monitoring
- BU-901: Fundamentals in Battery Testing
- BU-901b: How to Measure the Remaining Useful Life of a Battery
- BU-902: How to Measure Internal Resistance
- BU-902a: How to Measure CCA
- BU-903: How to Measure State-of-charge
- BU-904: How to Measure Capacity
- BU-905: Testing Lead Acid Batteries
- BU-905a: Testing Starter Batteries in Vehicles
- BU-905b: Knowing when to Replace a Starter Battery
- BU-906: Testing Nickel-based Batteries
- BU-907: Testing Lithium-based Batteries
- BU-907a: Battery Rapid-test Methods
- BU-907b: Advancements in Battery Testing
- BU-907c: Cloud Analytics in Batteries
- BU-908: Battery Management System (BMS)
- BU-909: Battery Test Equipment
- BU-910: How to Repair a Battery Pack
- BU-911: How to Repair a Laptop Battery
- BU-915: Testing Battery with EIS
- BU-916: Deep Battery Diagnostics
- BU-917: In Search for Performance Transparency with Batteries
- BU-918: Battery Endurance Plan
- BU-919: Building a Matrix to test Batteries
- BU-920: Matrix Library
- BU-921: Testing Batteries by Multi-Model EIS
- BU-922: What Causes Starter Batteries to Fail?
- BU-923: Getting Deep Cycle Batteries Mission Ready
- BU-924: Battery Ecosystem
- BU-925: EIS Direct Drive, non-invasive Capacity Test
- BU-926: Battery Diagnostics, an Overlooked Requirement
-
Amazing Value of a Battery
- BU-1001: Batteries in Industries
- BU-1002: Electric Powertrain, then and now
- BU-1002a: Hybrid Electric Vehicles and the Battery
- BU-1002b: Environmental Benefit of the Electric Powertrain
- BU-1003: Electric Vehicle (EV)
- BU-1003a: Battery Aging in an Electric Vehicle (EV)
- BU-1004: Charging an Electric Vehicle
- BU-1005: Does the Fuel Cell-powered Vehicle have a Future?
- BU-1006: Cost of Mobile and Renewable Power
- BU-1007: Net Calorific Value
- BU-1008: Working towards Sustainability
- BU-1009: Battery Paradox - Afterword
-
Information
- BU-1101: Glossary
- BU-1102: Abbreviations
- BU-1103: Bibliography
- BU-1104: About the Author
- BU-1105: About Cadex (Sponsor)
- BU-1106: Author's Creed
- BU-1107: Disclaimer
- BU-1108: Copyright
-
Learning Tools
- BU-1501 Battery History
- BU-1502 Basics about Batteries
- BU-1504 Battery Test and Analyzing Devices
- BU-1505 Short History of Cadex
-
Battery Articles
- Perception of a Battery Tester
- Green Deal
- Risk Management in Batteries
- Predictive Test Methods for Starter Batteries
- Why Mobile Phone Batteries do not last as long as an EV Battery
- Battery Rapid-test Methods
- How to Charge Li-ion with a Parasitic Load
- Ultra-fast Charging
- Assuring Safety of Lithium-ion in the Workforce
- Diagnostic Battery Management
- Tweaking the Mobile Phone Battery
- Battery Test Methods
- Battery Testing and Safety
- How to Make Battery Performance Transparent
- Battery Diagnostics On-the-fly
- Making Battery State-of-health Transparent
- Batteries will eventually die, but when and how?
- Why does Pokémon Go rob so much Battery Power?
- How to Care for the Battery
- Tesla’s iPhone Moment — How the Powerwall will Change Global Energy Use
- Painting the Battery Green by giving it a Second Life
- Charging without Wires — A Solution or Laziness
- What everyone should know about Battery Chargers
- A Look at Cell Formats and how to Build a good Battery
- Battery Breakthroughs — Myth or Fact?
- Rapid-test Methods that No Longer Work
- Shipping Lithium-based Batteries by Air
- How to make Batteries more Reliable and Longer Lasting
- What causes Lithium-ion to die?
- Safety of Lithium-ion Batteries
- Recognizing Battery Capacity as the Missing Link
- Managing Batteries for Warehouse Logistics
- Caring for your Starter Battery
- Giving Batteries a Second Life
- How to Make Batteries in Medical Devices More Reliable
- Possible Solutions for the Battery Problem on the Boeing 787
- Impedance Spectroscopy Checks Battery Capacity in 15 Seconds
- How to Improve the Battery Fuel Gauge
- Examining Loading Characteristics on Primary and Secondary Batteries
-
Language Pool
- BU-001: Compartir conocimiento sobre baterías
- BU-002: Introducción
- BU-003: Dedicatoria
- BU-104: Conociendo la Batería
- BU-302: Configuraciones de Baterías en Serie y Paralelo
-
Batteries in a Portable World book
- Change-log of “Batteries in a Portable World,” 4th edition: Chapters 1 - 3
- Change-log of “Batteries in a Portable World,” 4th edition: Chapters 4 - 10