
Capacity is the leading health indicator of a battery, but estimating it on the fly is complex. The traditional charge/discharge/charge cycle is still the most dependable method to measure battery capacity. While portable batteries can be cycled relatively quickly, a full cycle on large lead acid batteries is not practical for capacity measurement.
SAE (Society of Automotive Engineers) specifies the capacity of a starter battery by Reserve Capacity (RC). RC reflects the runtime in minutes at a steady discharge of 25A. DIN (Deutsches Institut für Normung) and IEC (International Electrochemical Commission) mark the battery in Ah at a typical discharge of 0.2C-rate (5h ate) for starter batteries. A 60Ah battery would discharge at 12A. No accurate RC to Ah conversion exists but the most common formula is RC divided by 2 plus 16. A short method is dividing RC by 1.9.
Discharge Method
One would assume that capacity measurement by discharge is the most accurate method, but this is not always the case, especially with lead acid batteries. Even when using highly accurate equipment in a temperature controlled environment and following established charge and discharge standards, variations between identical tests occur. This is not fully understood except to realize that batteries are electrochemical devices that have human-like qualities. Our IQ level also varies depending on the time of day and other conditions. Lithium- and nickel-based chemistries provide more consistent discharge results than lead acid.
Cadex labs checked 91 starter batteries with diverse performance levels, and the results have been plotted in Figure 1. The horizontal x-axis presents the batteries from weak to strong, and the vertical y-axis reflects the capacity. The tests followed SAE J537 standards by applying a full charge and a 24-hour rest, followed by a regulated 25A discharge to 10.50V (1.75V/cell). The results in diamonds represent Test 1. The test was repeated under identical conditions, and the capacities shown in squares characterize Test 2. Only done within days of each other, Test 1 and 2 differ much as +/-15 percent average in capacity. Other laboratories observe similar discrepancies.
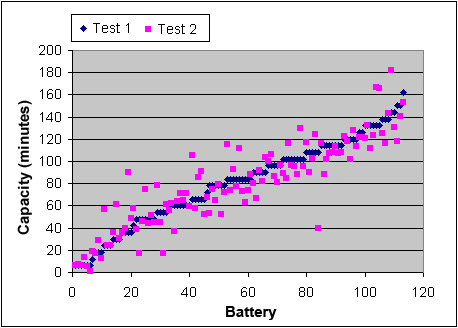
The capacities differ +/–15% between Test 1 and Test 2. Tests were done according to SAE J537
When evaluating battery test results, the question is asked: “Against what standard are the readings compared?” If done with the classic charge/discharge cycle that has large inaccuracies, then modern test technologies have no benchmark and scientists may ask: “Which method is more accurate, the discharge/charge method or other evolving technologies?” This is a valid question as non-intrusive technologies are emerging that only take seconds to test a battery.
Non-invasive Method
Spectro™ (by Cadex) uses multi-model electrochemical impedance spectroscopy (EIS) that checks battery health in seconds with a scanning process. The non-invasive technology combines EIS with complex modeling to estimate capacity, CCA and SoC with the help of matrices, also known as look-up tables. Here is how it works:
A sinusoidal signal of multiple frequencies is injected into the battery at a few millivolts. After digital filtering, the extracted signal forms a Nyquist plot onto which various electro-chemical models are superimposed. Spectro™ selects the best matching models; non-fitting replicas are rejected. Data fusion then correlates the values of the key parameters to derive at capacity and CCA estimations. Figure 2 illustrates the patented process in a simplified way.
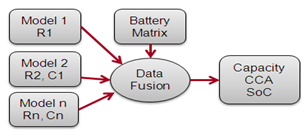
A sinusoidal signal produces a Nyquist plot; data fusion correlates the values of the key parameters to estimate capacity and CCA.
The Nyquist plot was invented by Harry Nyquist (1889–1976) while at Bell Laboratories. It presents the frequency response of a linear system displaying both amplitude and phase angle on a single plot using frequency as parameter. The horizontal x-axis of a Nyquist plot reveals the real ohm impedance while the vertical y-axis represents the imaginary impedance(See BU-907: Testing Lithium-based Batteries)
Capacity vs. CCA
Starter batteries have two distinct values, CCA and capacity. These two readings are different; one cannot predict the other and correlation between the two is almost non-existent, except perhaps towards the end of battery life(See BU-806, Tracking Battery Capacity and Resistance as part of Aging)
Most rapid-testers look at the internal resistance and do a CCA approximation. Reading battery resistance is relatively simple, but this alone cannot predict capacity, nor can it tell when to replace a battery as the end-of-life characteristic is primarily capacity related. Most starter batteries crank the engine with very little capacity; a sudden failure might occur when the capacity drops below 30 percent.
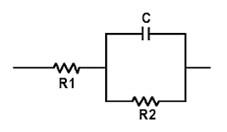
Some battery testers, including Spectro™, display “Resistance High” when the ohmic reading is elevated, a failure that commonly relates to heat damage. A working starter battery reflects a single-digit mOhm value that is represented by R1 in the Randles model on the right(See BU-902: How to Measure Internal Resistance) Batteries developing high resistance move into double-digit readings, and these can be caused by these conditions:
- Low electrolyte level(See BU-804c: Water Loss, Acid Stratification and Surface Charge)
- Stratification of electrolyte(See BU-804c: Water Loss, Acid Stratification and Surface Charge)
- Sulfation of electrodes(See BU-804b: Sulfation and How to Prevent it)
- Bad or deteriorated weld connections of the collector plates and posts
- Collector plate cracking corroded(See BU-804a: Corrosion, Shedding and internal Short)
- Poor battery connection at the clamps or internal to the battery
R1 represents the electrolyte resistance, which is affected by items 1 and 2 above. Items 3 to 6 relate R1 characterizes the electrolyte resistance created by low electrolyte and/or acid stratification as reflected in items 1 and 2 of the above listed conditions. Items 3 to 6 relate to sulfation, corrosion and contact resistance from the battery posts to the electrodes as well as the electrodes to the electrolyte.
The R2/C parallel circuit represents charge transfer resistance and speed. It signifies the required energy needed to overcome the potential barrier at the electrode-electrolyte interface that activates the ion inside the electrolyte, which results in moving electrons from the electrode to the terminals. On a poor battery, the barrier resistance is higher than in a good battery with high capacity. The R2/C branch holds the secret to capacity estimation and differ from the more mechanical conditions captured in R1.
The ability to separate individual components in the Randles model, as Spectro™ does, enables improved battery assessment that reduces battery replacement, especially during the warranty period. “Resistance High” distinguishes a battery with low charge from one that has a genuine defect. The test can be done with a partial charge.
“How accurate are the readings?” car mechanics ask. This depends on the battery. A fault can only be diagnosed with confidence if clear symptoms are present. A new battery or one that has been in storage can become an outlier on capacity estimation. Best results are achieved with a “working” battery that is pulled from service. Accuracy is also based on the quality of the matrix(See BU-905: Testing Lead Acid Batteries, Matrix).
Although capacity and CCA readings are clearly marked on the battery, these values are not always correct. The CCA of some starter batteries are found to be higher or lower than shown; only the manufacturer would know. Because of high cost, CCA tests are seldom done once the battery is sold. In addition, deep-cycle batteries show low capacity readings when new and this could lead to warranty returns. The values will increase as the battery is being formatted with use(See BU-701: How to Prime Batteries)
References
[1] Courtesy of Cadex (2005)
[2] J. Tinnemeyer, "Fuzzy logic method and apparatus for battery state of health determination". US Patent US7072871B1, 4 07 2006-07-04.
Last Updated: 4-Nov-2021

Batteries In A Portable World
Looking for comments from the previous website?
Comments from the previous website are not compatible with our new commenting system but we have preserved them so our users can still reference and make use the information in them.
Show Old Comments
On January 1, 2019, Julian Liu wrote:
Hi, Some of the manufacturers use the "conductance technology" to determine the battery capacity (not the CCA), e.g. Midtronics. How accurate is this method? I would like to measure the capacity (not CCA) of the batteries in my RV (two AGM each 105 Ah) with relatively easy use portable instruments. If the inaccuracy is small, I can probably tolerate it. Best Regards, Julian
On October 30, 2018, Ian wrote:
Can I use a Midtronics or similar algorithmic tester to test Mobility Scooter SLA batteries. I am trying to establish remaining capacity. Thanks. Ian
On January 17, 2018, Phillip wrote:
Why does the SAE test "starting" batteries by discharging them to 10.5V, when it is recommended that starting batteries not be discharged below about 11.5-11.8V? "SAE J537 standards by applying a full charge and a 24-hour rest, followed by a regulated 25A discharge to 10.50V (1.75V/cell)"
On November 17, 2017, Jonny paget wrote:
I have a N150 sealed lead acid battery for a house battery on my boat it is charged by solar and wind generator, both regulators go into float mode around same state of charge, but battery seems to go flat fairly quickly, what can cause this seeming lack of capacity and is there a remedy, thanks, Jonny.
On November 1, 2017, VENGADESH wrote:
how to calculate Ah/Capacity Based on Plates and its weight (Lead acid battery ) Please explain With one example.
On October 12, 2017, Dilojan Romesh Senanayake wrote:
I purchased the following power supply from Amazon a few days ago. The Costway/Safstar regulator output voltage and output current do not agree with the multimeter reading. Safstar Adjustable Power Supply 30V 5A Precision Variable DC Digital Lab w/clip - https://www.amazon.com/gp/product/B01IHG8D8O/ref=oh_aui_detailpage_o09_s00?ie=UTF8&psc=1 When the Costway power supply is set to "constant current" of 0.8 A (Amperes) the regulator LED (Red) reads 0.43 V for voltage the multimeter reads 200.9 mV (~0.2 V) once load is applied. The current on the Costway power supply reads 0.80 A while the multimeter reads 1.4 A. See attached picture with two multimeters on either side of power supply. Sorry there is no way to attach the picture
On September 15, 2017, Dilshan Rassideen wrote:
Like to know battery servicing, repair and maintenance course institute in Ontario
On August 6, 2017, Hobart Dixon wrote:
The formula seems like a fake with no origin or source reference. I first time see such illegal relation between current and capacity. At least Peukerts law can followed instead of missleading the capacity information....
On July 31, 2017, Ahmad wrote:
I have a laboratory specialist in battery types in Tehran, my laboratory is approved by the National Iranian Standards Organization, I will ask you to provide a list of the equipment needed to perform battery type tests in accordance with the requirements of IEC standards, along with the price and delivery conditions for me. declare. I hope we can communicate more closely in the near future
On September 8, 2016, john random wrote:
Ok, so the discharge method is a bit flawed, but could someone provide a link describing how to do it with standard circuit parts? I understand you can measure the current across a known load and some sort of time measurment too, but I'm not sure what one then does with the time and current measurements to work how many mAH are left. This link shows a discharge curve http://i.stack.imgur.com/UkodS.gif for a randomly selected battery type that hasn't previsouly been tested by you to determine this curve how do you use such measurements (the time I've heard about is much shorter than the full discharge time) to find the mAH left in the battery? Thanks.
On August 18, 2016, harish wrote:
how to draw a charge and discharge curve and also how to calculate and draw the capacity and chager,what are the instrument available to measure this property,i ask instrument means like xrd,sem, tem
On November 17, 2015, kiran wrote:
pls guide me ias i want to design battery analyser for my handheld radios battery 7.2vols .
On October 25, 2015, abdelmoniem hamed wrote:
Very informative .Iwould grateful of could send me quotation for atester to carry capacity and cc/a test on autombile battaries cap. Up to 200A/H.
On October 25, 2015, abdelmoniem hamed wrote:
Very informative. Can you send me quatation for atester to carry tests on lead acid storage batteries for capacity and cold cranklng for batteries up to 200 A/H.
On October 6, 2015, HW_Freak wrote:
My Load Power is 10W. Battery : 4.2V max, 1800mA max 3.7V nominal What will the load current on the Li-ion Battery..? Can anyone pl let know..
On September 23, 2015, timm wrote:
SAE specifies the capacity of a starter battery by reserve capacity (RC). RC reflects the runtime in minutes at a steady discharge of 25A. DIN and IEC assess the battery in Ah and measure the runtime at a typical discharge rate of C/20 (5h rate) for starter batteries. A 60Ah would discharge at 12A. C/20 means 20 hour rate... 60ah discharge 3a in 20 hours.... Isnt it?
On August 6, 2015, Ashvin wrote:
How I can undestabilising 100 ah battery take how much load..?
On July 5, 2015, B.V.S.Prakash wrote:
26400mah li-ion How do I convert in v / ah
On December 29, 2014, Ruparathna Amuwala wrote:
I need to know how to find CCA value of 12 v 200ah lead acid battery
On October 17, 2014, prakash wrote:
i need to find cca value of 12v,42ah battery i need full calculaton
On September 23, 2014, Zack Philip wrote:
Your site is fantastic... How can i convert 350CCA to AMPHours?
On July 18, 2014, ziad wrote:
exclent site
On April 24, 2014, Nick Bordujenko wrote:
G'day all, I'd like to share my limited knowledge with some of you, if I may. Most people I worked with often asked me how long does a car battery last? Well, how long is a piece of string? - Ambient temp effects how a battery performs, & how long it will last. The rule of thumb is the hotter the climate, the better cranking you will get out of the battery albeit with a shorter lifespan, but the opposite effect for colder climates - the battery will have a longer lifespan, but with less performance. The quality of materials used to construct a battery internally has a lot to be said for. The Panasonic batteries that come out of Japan in Toyota's are a great battery. I have had 6 years out of one in my Toyota Hilux. I have also seen an Optima Red Top 34R starting SLAB get 8 years plus in the tropics. So choosing the right battery is just as important as maintaining it correctly. I believe it is fair to say that - You only get what you pay for. I believe that it would be fair to say that most people's knowledge or understanding of how to keep a battery in peak condition is pretty poor, either by lack of education or plain ignorance. Lack of regular maintenance charging, (short drives to and from work), and lack of maintenance in topping up water (if applicable) leads to a shorter battery life by the operator. A really good indication that your battery is sulphated, and is on the way out is a simple visual check. If the battery's end cases are visually swollen, (bowed out), than the battery is sulphated and it's life span has been severely shortened. You would expect to up for a new battery in the not too distant future. The sure fire way of keeping your battery in ship shape is to regularly charge it with a smart charger, I personally use a CTEK 7 amp charger, but any other brand will do the job. Also if the battery is a vented lead acid battery (the type where distilled water is required to top up the cells), then regular inspections and top ups should be done iaw your vehicle's or battery's manufacturer's recommendations. If you allow the cells to become exposed, you will kill a battery. In the workshop, we kept our batteries fully charged, and never let the batteries open circuit (O/C) voltage to drop below 12.5 volts. This is where most people especially folks with fishing or ski boats get into trouble, especially neglecting their batteries and they go flat.. A fully charged battery, left sit for 24 hours should have a O/C voltage = to or greater than 12.5 to 12.6 volts. This is 100% charged. If you have a battery that loses voltage relatively quickly over a few days to a week, than you have some internal resistance discharging your battery - There could also be some minor current draw, so isolating your battery in these situations is recommended. This could mean that the battery is suffering from sulphation, and it's time to get yourself a replacement battery pronto. When a battery's voltage drops below 12v, then sulphation starts to build up on the cells. when this happens, your batteries internal capacity decreases. It is possible to do a load test of the battery via a carbon pile load tester, this is the best way I have found. Load a fully charged starting battery up to half the battery's CCA rating for 10 - 15 sec. As long as the battery stays above 9.6v, then it's serviceable, if not, charge and re-test. For a vented lead acid battery, using a hydrometer, check the specific gravity. If any of the cells are in the red, or are 50 points or more differnce, it's time to get a new battery. If you don't have access to a carbon pile load tester, an easy way of doing a load test on your vehicles battery yourself on your car is to get a volt meter and measure the battery's voltage prior to starting, and then during starting. As long as the battery's voltage is healthy (above 12.5v) prior to starting and it doesn't drop below 9.6 volts during the cranking of the starter motor, then you have yourself a serviceable battery. Unfortunately there is no way knowing how much life you have left in your battery at any given point of time. It is important to remember to keep on top of the maintenance of your battery and keep it charged regularly, at least monthly, for a longer battery life. A rough, but easy way to work out your batteries state of charge - O/C voltage is: 12.6v = 100% (Fully Charged) 12.5v = 90% 12.4v = 80% 12.3v = 70% 12.2v = 60% 12.1v = 50% 12.0v = 40% 11.9v = 30% 11.8v = 20% 11.7v = 10% 11.6v = 0% (Flat Battery) Cut off voltage (DEAD BATTERY) = 10.5v As you can see, 1 volt is all there is between a fully charged battery and a flat one, and shows the importance of keeping your battery charged, not only for a longer battery life, but to prevent an embarrassing situation of having a flat battery, and it always happens at the worst possible time, doesn't it?. Cheers, Nick.
On March 12, 2014, AW wrote:
In relation to Doug Devries comment, I am unsure of the origin of the Ah = RC/2 + 16, but I imagine it is empirically determined. I have also seen Ah = 0.6*RC. Your equations are correct, but this will always be an underestimation of the actual Ah rating. The reason for this is that the 25A current draw on the RC test will be higher than that used to determine the Ah rating. Because you will get more energy out of a battery if the total current draw is lower for a longer period of time (Peukert's Law), your conversion will underestimate RC. Hope that makes sense.
On March 9, 2014, mo wrote:
Is the internal construction of an IEC battery different than a CCA? If I had both batteries infront of me but didn't know wich one was wich, what would be a good bench mark test rating to use. I use a midtronics exp800 and have nine ratings to pick from. SAE,JIS,EN,DIN,CA,CCA,MCA,EN,IEC, If I test an IEC or EN battery with CCA or SAE rating the amp measurement is drasticly higher Does one battery discharge differently than the other given the same conditions? thamks m
On March 7, 2014, Doug Devries wrote:
Article states Ah = RC / 2 + 16. This seems incorrect. RC is defined as the time in minutes that a 12V battery can deliver 25A while maintaining 10.5V our greater. Therefore: Ah = 25 A * RC (minutes) / 60 min / h OR Ah = RC * 0.416667 A battery with a RC of 120 minutes has a measured capacity of 50 Ah when discharged at 25A The RC / 2 + 16 method of capacity calculation yields 76 Ah - clearly incorrect. Can anyone explain the origins of the RC / 2 + 16 = Ah calculation?
On June 4, 2013, Randolf de Leeuw wrote:
If the capacity fluctuations of a starter batterie is +/- 15%, wath wil be the fluctuation if you mesure this by li-ion betteries?
On April 27, 2013, Robert H. wrote:
s. mateen: sorry for being the mistype and vagueness on my first post. I meant to say 12.25 vdc is an almost dead battery, and the variances of 0.02 apply to both specific gravity differences on first mention, and 0.02 vdc variances on the individual cell voltage checks. Btw, indidvidual cell voltages should be 2.1 (typically considered full charge on a servicable lead acid battery) on individual cells, but in no case would I be comfortable with less than 2.09 vdc (about 75% charge) if you want any measure of dependability. All measurements should be taken only when any charging has been completed for at least 24 hours.
On April 27, 2013, Robert H. wrote:
s. mateen: I wrote the above for deep cycle or rv/marine start battery use because you mentioned "100 ah", but if your battery is an auto battery or some other starting battery, simply do everything as described up to the load test point, then change the load test to accomodate a starting battery - which is a load test based on the CCA, or take it to your local auto parts store for them to check the batteries after you have charged, filled, topped off the charge, and let the battery rest for a full 24 hours. If it doesn't test good after this, my guess is it may need professional charging/servicing to be saved (if that will do it).
On April 27, 2013, Robert H. wrote:
s. mateen: I am a novice, but...1.25 is almost fully discharged. The longer they were stored at this low open voltage, the greater likelyhood of a weakened battery. The best option from my perspective would be to remove the batteries and gently rock them side to side for 3 - 4 minutes, check the acid levels (use only distilled water - assuming no battery leaks) and verify acid levels are at covering the plates. If the levels are low but covering the plates, completely charge with a good quality smart charger (battery minder, schumacher), then check the specific gravity; I would want no more total variation of 0.02 from the stongest cell to the weakest. Assuming an "o.k." S.G. reading, finish filling the cells as needed (do not overfill), and charge again with a 2 amp smart charge until completely charged. Be sure your smart charger is set for either "deep cycle" or "marine", or "STD", but for sure NOT AGM or GELL! Recheck S.G. - it should be 1.25 minimum on any one cell (in the green of the hydometer) and still withing the 0.02 S.G. variance maximum bron the best to the worst cell. If this is good, follow battery universities' instructions for measuring each cells individual voltage which I would want to vary by no more than 0.02. If you can, then load test the battery with no more than a 25 amp draw. and it should test good for at least 3 1/2 hours. If still good, repeat the 2 amp charge to full charge, and put into service. There are a number of other tests, and if this is totally foriegn to you, have a qualified battery service check the batteries for fitness to use. Always abide by safe battery handling precautions; eye, vapor, and skin protection, etc. I believe this is all good advice and safe, but only if done correctly and by someone comfortable and familiar with batteries. No guarntee though, and there are risks with handling batteries, so I must disclaim any responsibility for this information, "at your own risk". Please verify this information with someone qualified if your unsure of what your doing. The short alternative version: Take them to a service shop with a good reputation, and have them tested and serviced before using or depending on them.
On April 17, 2013, s. mateen wrote:
We have stored Lead acid batteries for about 12 months without charging and now we want to use them. We have measured the voltage of the batteries are more than 12.25vdc per battery (100 ah). Are there any risk of using them? What should we do before using them? Should we just throw them away? Please help me urgently. I need help to make the decision. Thanks a lot.
On July 17, 2012, Wayne wrote:
Marcus, the first line is straight because the graph was constructed by placing the 91 batteries in order of weak to strong based on the first test. On the second test the batteries remain in the same order but the inacuracies cause the data points to spread out.
On February 13, 2012, hisannah wrote:
Plan is to install an 89 amphour agm for a bilge pump which draws 7 amps. Recharge will be with a solar panel. Runtime is estimated/desired to be 2 hours total, (intermittent 15 minute cycles) service. Will the battery be sufficient? What size solar output is needed to recharge in three days and still remain connected to float the battery? The pump flowrate varies in direct proportion the speed. Speed varies to the square of the voltage. Its pressure varies to the cube of the speed. What is the expected fall-off of the voltage versus time? With this I can calculate the real-time flow and pressure and obtain a useful life of the pump without destrying the battery. Anybody care to submit their ideas on this
On December 6, 2011, Marcus wrote:
figure 1 doesn't make sense. If capacity readings are +-15% inaccurate, how could the first test results draw such a perfect line?
On November 23, 2011, nick bell wrote:
can i get tables or graphs or info on depth of discharge vs voltage .. i have 12 x 2v 1550 amp hour batteries and want to be able to monitor them if possible with a volt meter
On March 30, 2011, arup kumar hbussain wrote:
sir how can we calculate a 12volt/ 80ah battery efficiency is 90%(lead acid battery)
Good day how do I refurbish a e-bike battery 12v/20amp 3 years old not pregnant clean looking